Customers
You can manage customers by going to the Customers page in the ComPilot Dashboard.
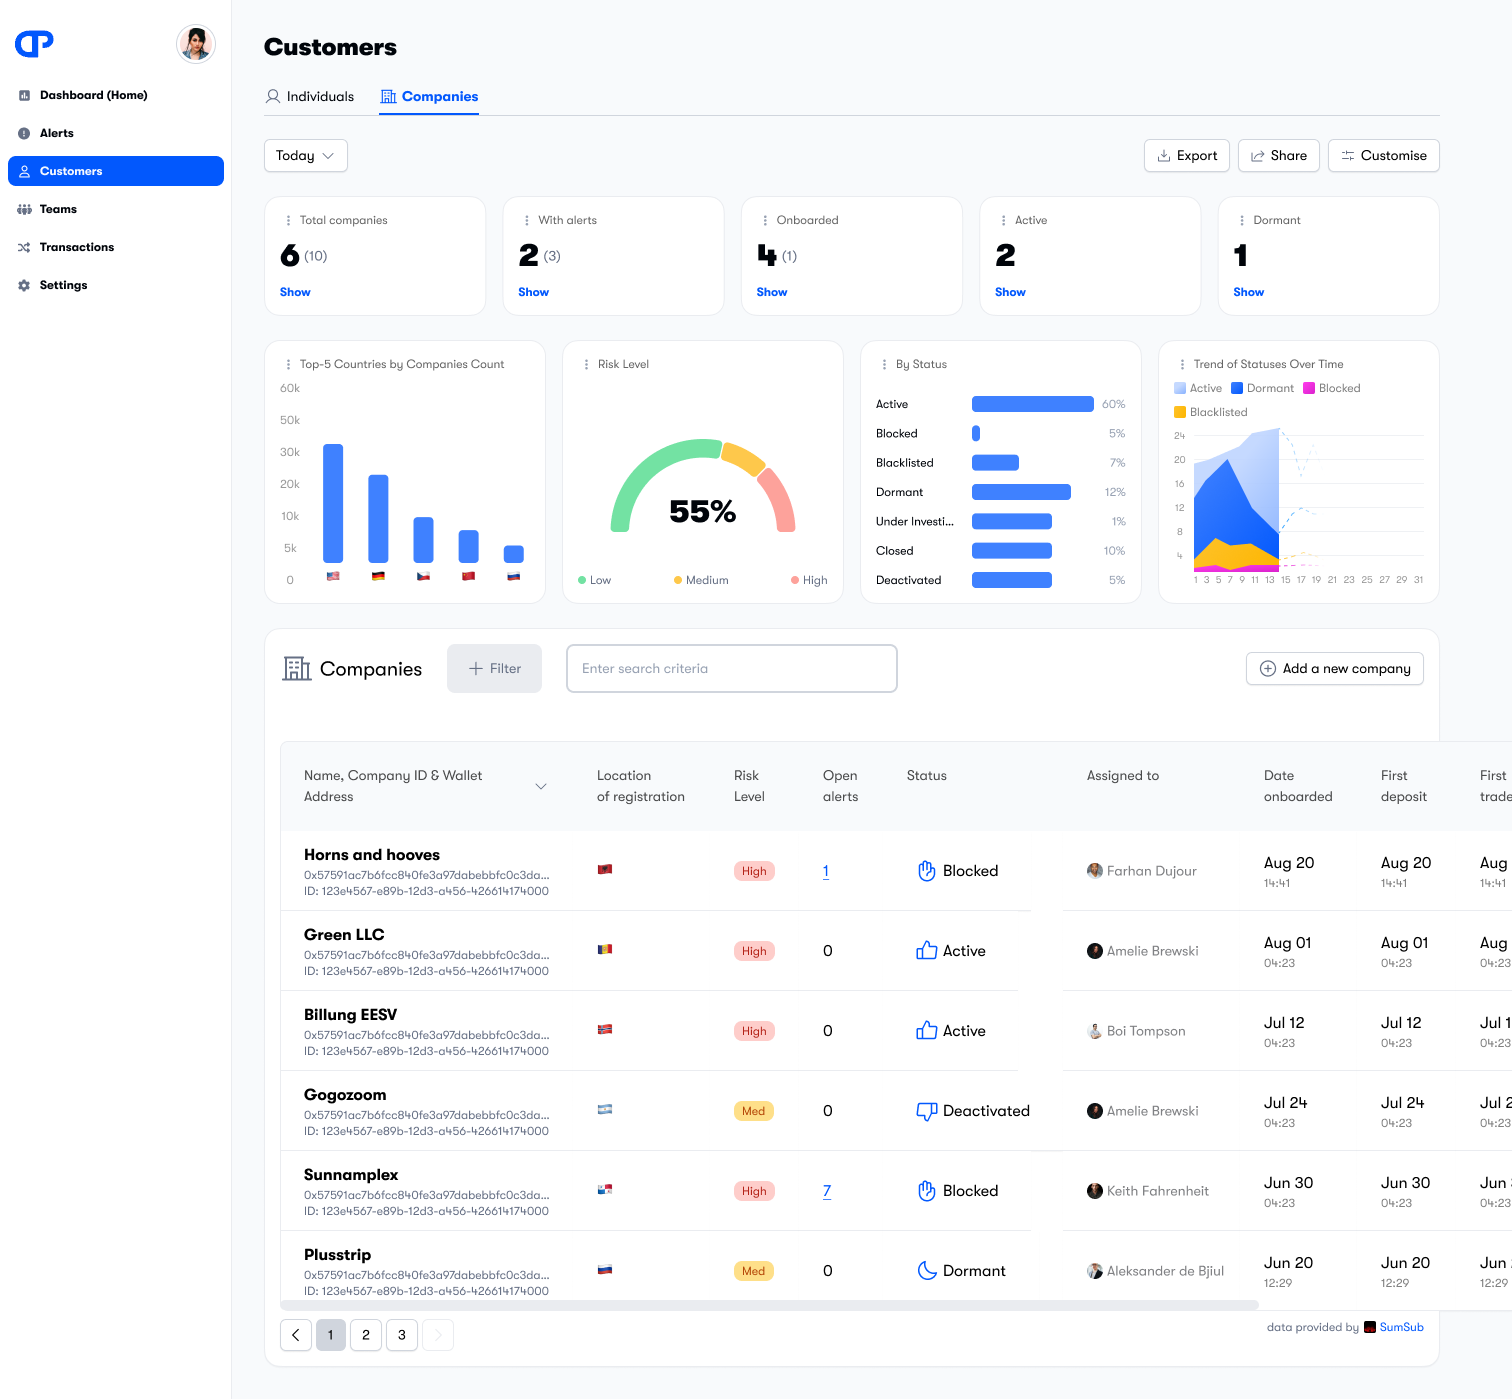
The Customers page displays a list of customers and some metrics about them.
Customers are either individuals or companies. You can switch between the different customer types by clicking on the Individuals and Companies buttons at the top of the page.
![]()
The metrics are displayed in a series of widgets and are described below.
You can change the time period by using the time period filter ![]() and you can change which widgets are displayed by clicking the Customize button
and you can change which widgets are displayed by clicking the Customize button ![]() . Each user in your organization can have their own customizations, and the customizations persist even after you log out. This means every user in your organization can customise the dashboard according to their own needs.
. Each user in your organization can have their own customizations, and the customizations persist even after you log out. This means every user in your organization can customise the dashboard according to their own needs.
You can filter the customers in the list by clicking the + Filter button, and search for customers using the search field. You can customise which fields are displayed by clicking the Customise button at the top right of the list.
Filters and searches are persistent, and remain in place until cleared or you log out.
Clicking on a customer in the list will display their details.
Metrics
The metrics widgets display a range of information that help you to track the status of your customers and help you manage them.
Some metrics only display data for the selected time period. Others display data for all time.
If a widget displays a small number in brackets after the large number, the small number applies to the previous time period. For example if your time period is set to "Week" the large number refers to data over the past seven days, and the smaller number refers to data from the seven-day period before that. The percentage change will be shown underneath.
If you have selected individuals as the customer type, the metrics will only apply to customers who are individuals. If you have selected businesses, then the metrics will only apply to customers who are businesses.
| Metric | Uses time period | Description |
|---|---|---|
| Total customers | Yes | Number of new customers in the time period. |
| Onboarded | Yes | Number of customers onboarded in the time period. |
| Active | Yes | Number of customers who had their status changed to Active in the time period. |
| Dormant | Yes | Number of customers who had their status set to Dormant in the time period. |
| Blocked | Yes | Number of customers who had their status set to Blocked in the time period. |
| Top 5 countries by customer count | No | Bar chart showing the top five countries of residence by customer count. |
| Customers risk level | No | Half-pie chart showing customers by risk level. |
| Customers by status | No | Bar chart showing customers by status. |
| Trend of statuses over time | No | Line chart showing statuses over time. |