ComPilot Dashboard
The ComPilot Dashboard is the control center for configuring the compliance process and is also a unique source of data on your customers. On the ComPilot Dashboard, you can:
- Configure your compliance process by building and maintaining workflows and configuring the ComPilot Rules Engine.
- Manage your customers.
- View alerts.
You can use the ComPilot Dashboard to monitor activity metrics and alerts, and to manually manage customers on a case-by-case basis.
Activity metrics are described on this page. Alerts and Managing customers are described on following pages.
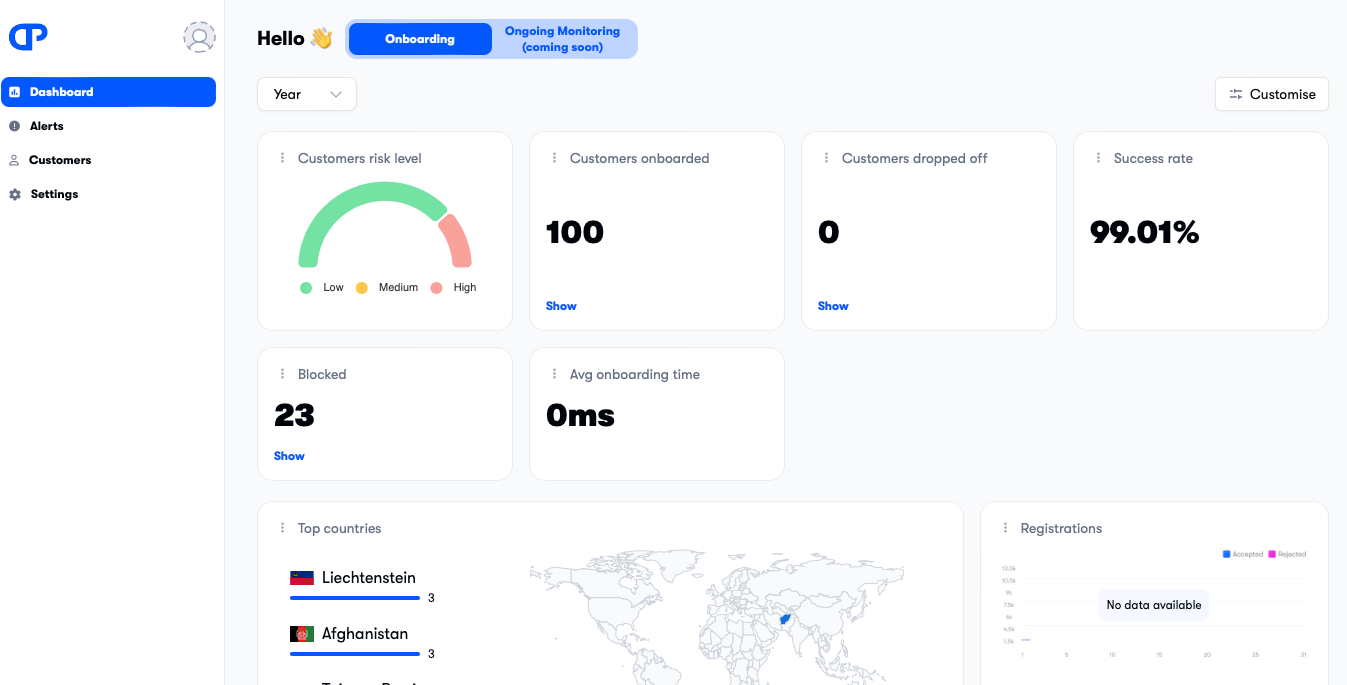
You can view customer activity metrics by going to the home page in the ComPilot Dashboard.
Customers are either individuals or companies. You can switch between the different customer types by clicking on the Individuals and Companies buttons at the top of the page.
![]()
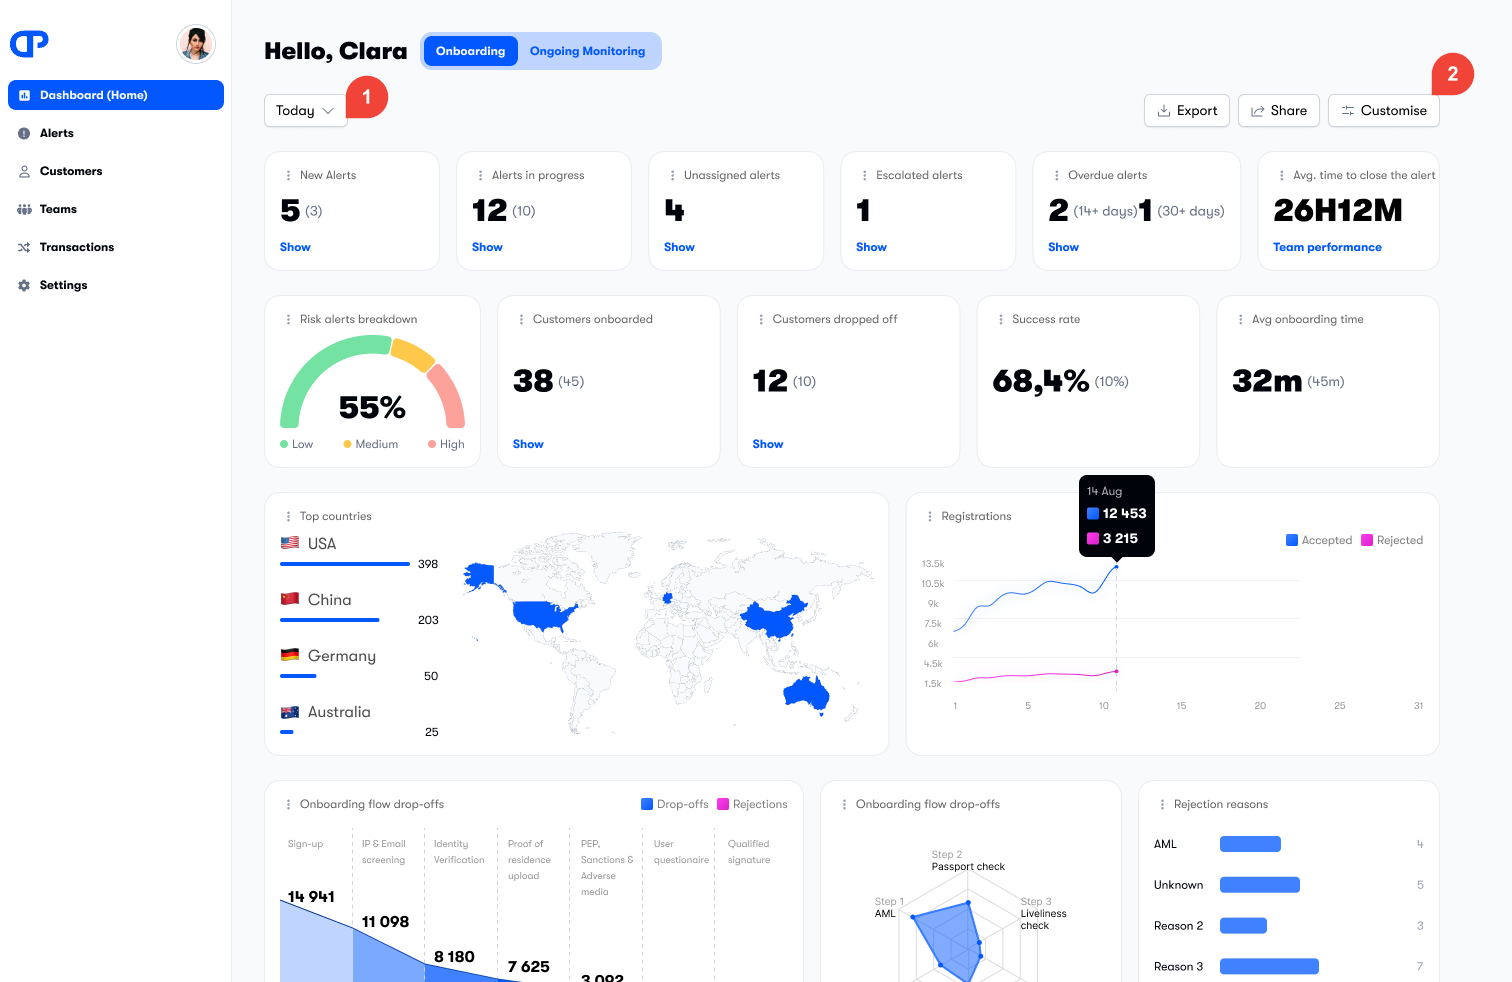
The metrics are displayed in a series of widgets and are described below.
You can change the time period by using the time period filter ![]() and you can change which widgets are displayed by clicking the Customize button
and you can change which widgets are displayed by clicking the Customize button ![]() . Each user in your organization can have their own customizations, and the customizations persist even after you log out. This means every user in your organization can customise the dashboard according to their own needs.
. Each user in your organization can have their own customizations, and the customizations persist even after you log out. This means every user in your organization can customise the dashboard according to their own needs.
Alerts are displayed at the bottom of the page. For more information, see Alerts.
Metrics
The metrics widgets display a range of information that help you to track the status of your customers and help you manage them.
Some metrics only display data for the selected time period. Others display data for all time.
If a widget displays a small number in brackets after the large number, the small number applies to the previous time period. For example if your time period is set to "Week" the large number refers to data over the past seven days, and the smaller number refers to data from the seven-day period before that. The percentage change will be shown underneath.
If you have selected individuals as the customer type, the metrics will only apply to customers who are individuals. If you have selected businesses, then the metrics will only apply to customers who are businesses.
| Metric | Uses time period | Description |
|---|---|---|
| New alerts | Yes | Number of unopened alerts created in the selected time period. When an alert is created, it is new. Once it has been opened it is no longer new. |
| Alerts in progress | Yes | Number of alerts created in the selected time period with status set to Under investigation. |
| Unassigned alerts | Yes | Number of alerts created in the selected time period that are not assigned to an officer. |
| Escalated alerts | Yes | Number of alerts that had their status set to Escalated in the selected time period. |
| Overdue alerts | No | Number of alerts that are overdue (unopened) by 14 to 30 days, and the number of alerts that are more than 30 days overdue. |
| Average time to close alerts | Yes | Average time to close the alerts |
| Customers risk level | No | Half-pie chart showing customers by risk level. |
| Customers onboarded | Yes | Number of customers onboarded in the time period. |
| Customers dropped off | Yes | Number of customers who have not completed the KYC flow in the selected time period. |
| Success rate | Yes | Percentage of customers who successfully completed the KYC flow in the selected time period. |
| Blocked | Yes | Number of customers who had their status set to Blocked in the time period. |
| Average onboarding time | No | The average onboarding time for new customers. |
| Top countries | No | Bar chart and map showing the top five countries of residence by customer count. |
| Registrations | No | Line chart showing the number of accepted and rejected registrations by time. |